
- Home
- knowledge management
- what is poor knowledge actually costing your operation
Tool

Free ROI Calculator: What Is Poor Knowledge Actually Costing Your Operation?
Take the free 10-minute assessment. Get a personalized cost estimate and action roadmap. Instantly!
Calculate Your Cost!
$1.5M/yr
these are the estimated annual cost of poor knowledge management per 100 customer service agents!
Most customer service leaders estimate their knowledge gaps cost time and quality, but few have seen the real number.
This interactive self-assessment gives you a personalized cost estimate and a concrete roadmap to close the gap.
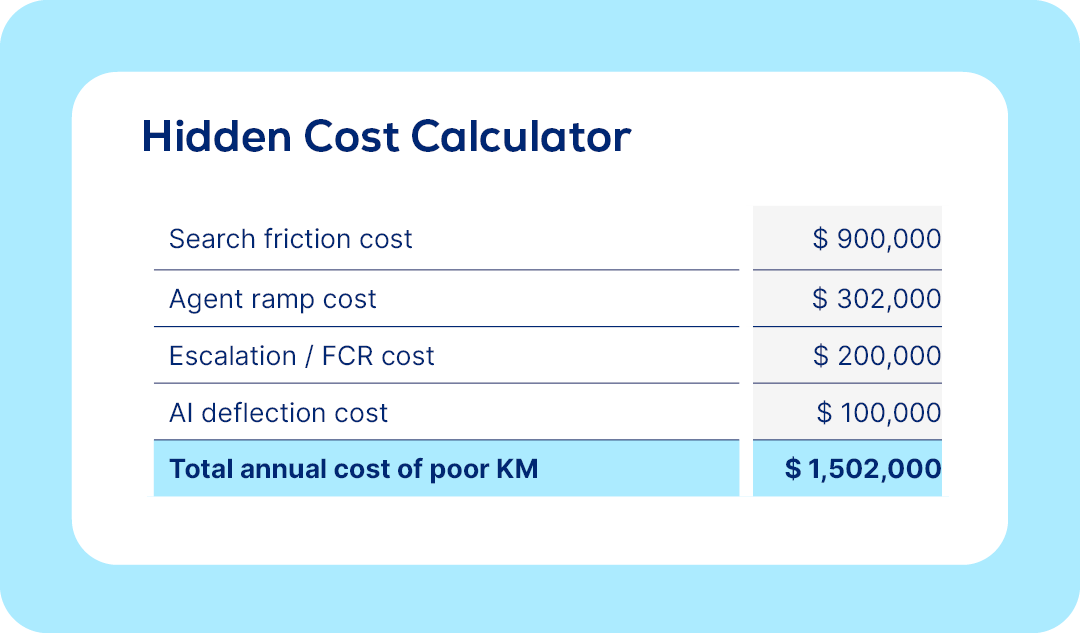
Here's where the $1.5M goes
900 $
agents searching 30% of their shift
300 $
slow onboarding drag (35 hires × 8-week ramp)
200 $
escalations and FCR failures
100 $
AI hallucinations and compliance exposure
What you'll have in under 10 minutes
Personalized ROI calculator + KM audit checklist
Plug in your headcount, handle time and turnover rate. The built-in calculator returns your estimated annual cost of poor knowledge management. This tool shows you your number, not a generic one.
Industry-Specific Benchmarks
Compare potential impact and payback periods across Financial Services, Telecom, Retail and Healthcare.
Two anonymized use case examples
Learn how a consumer brand cut onboarding from 4 weeks to 3 days and pushed NPS from under 20 to 48.
The assessment is free, personalized and built for customer service leaders who need a business case, not just a brochure. Get your cost estimate and your roadmap. No sales call required to get your number.
FAQ
Our knowledge is spread across six systems. Will this work with our current stack?
That's exactly the situation this assessment is designed for. The maturity framework accounts for fragmented, multi-system environments and helps you prioritize which integration moves the needle fastest—without requiring you to rip and replace everything at once.
Our data quality is inconsistent. Won't that undermine any ROI calculation?
Imperfect data is the norm, not the exception. The calculator uses industry-validated defaults (based on 150+ enterprise deployments) wherever your own data has gaps, so you get a credible estimate even before a formal audit. This assessment also includes a KM audit checklist to help you assess and improve your content baseline.
How long does it typically take to see a return on a KM investment?
Based on USU deployment data, payback periods range from 8 to 16 months depending on industry and scope—with AHT reductions often visible in reporting within 30 to 60 days of go-live. The assessment breaks this down by vertical so you can benchmark against organizations like yours.
We've looked at KM platforms before. Implementation always ends up being the hard part.
That's a fair concern—and the whitepaper addresses it directly. You'll find a phased implementation roadmap, realistic adoption timelines (90% agent adoption in week one is standard for USU deployments), and a breakdown of what drives success versus what typically causes rollouts to stall.


